Testing the frequency response
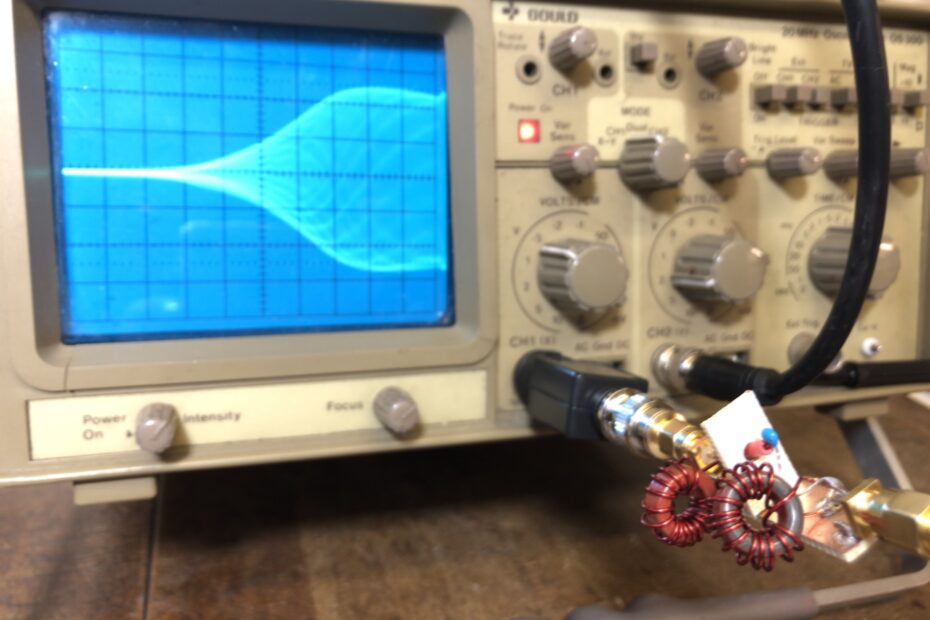
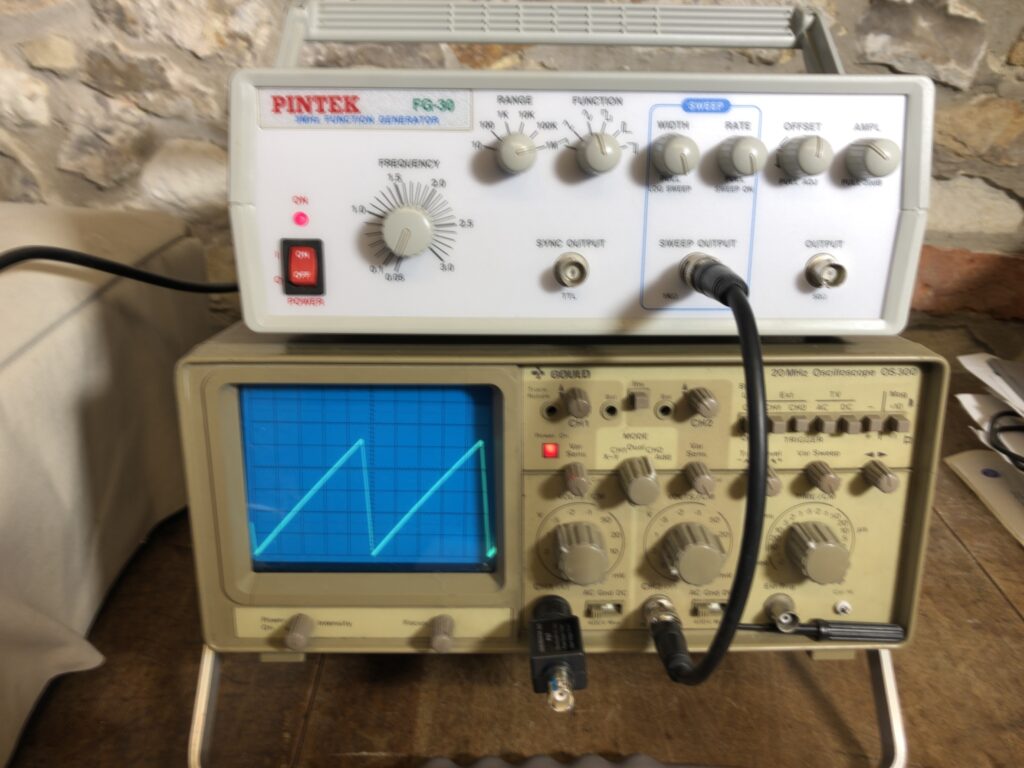
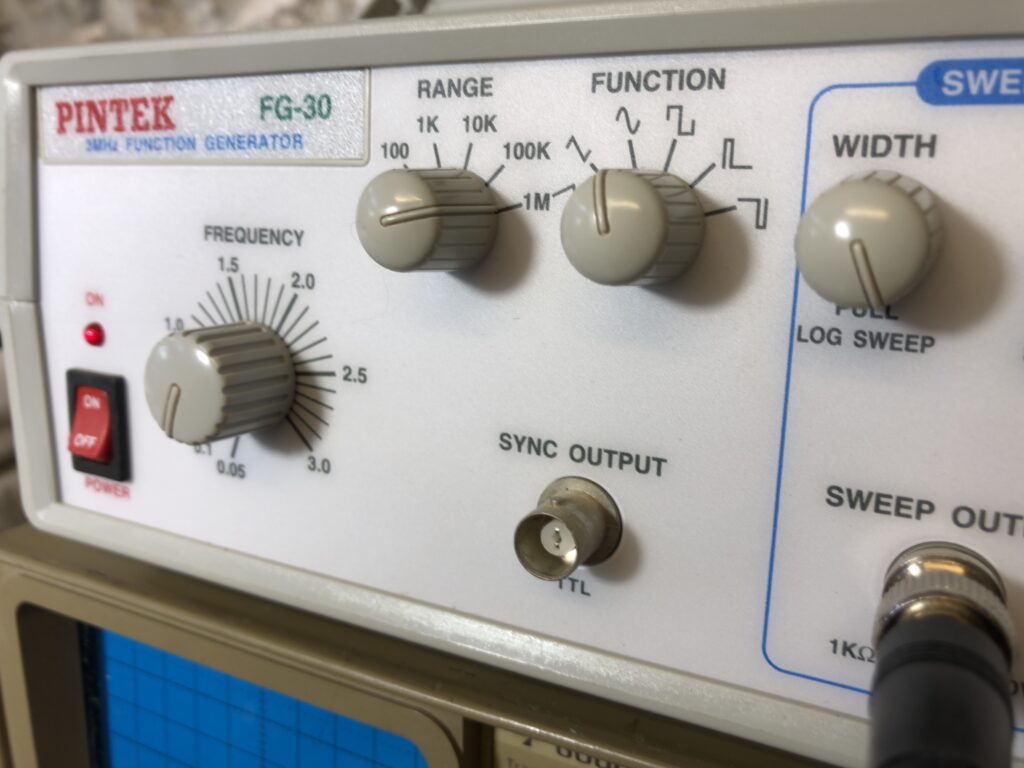
Whilst NanoVNAs are superb for testing and viewing the frequency response of a filter, you can do the same thing with an old analogue oscilloscope and function generator. In this article, I’ll be using my Gould OS300 ‘scope and Pintek FG30 function generator to test a home-brew high-pass filter that I’d built. We will then compare the trace from the ‘scope to that produced by the NanoVNA.
Equipment needed
You’ll need an oscilloscope that has a high enough bandwidth to cope with the frequencies that you want to test. My high-pass filter should allow anything over 3MHz through and attenuate anything below that, so I’ll be using frequencies up to around 3-3.5MHz. Clearly, you also need to make sure your function generator can also produce the range of desired frequencies too.
You will also need a function generator that is capable of sweeping through a range of frequencies. Whist you could set one frequency, note the voltage output, set a new frequency, note the voltage out, set the next frequency… which soon becomes tedious! It is much better to sweep through a range of frequencies and view the response curve directly on the oscilloscope.
You’ll need relevant cables and adapters to connect the filter into the circuit too, of course.
Testing The Response
On the function generator set the sweep rate. This is the amount of time that it will take to sweep the range of frequencies that you want – for me, I want to sweep from 100kHz to a little over 3.0MHz and I set the rate to an arbitrary amount (don’t set this too slow as the trace will then take longer to build).
Connect the sweep output to CH2 on the scope and set the oscilloscope to trigger on CH2 Ext. The sweep output from the function generator is a ramp waveform and once the ramp gets to it’s maximum value, it then drops back down before ramping up again. That shift from positive to ‘negative’ is steep and it makes sense to use that to trigger the scope.
I set the ‘scope to trigger on the negative slope, then adjust the Trig Level to trigger close to the lowest point.
Now adjust the timebase (time/cm) to a value so that one cycle of the ramp waveform does not fit on to the screen.
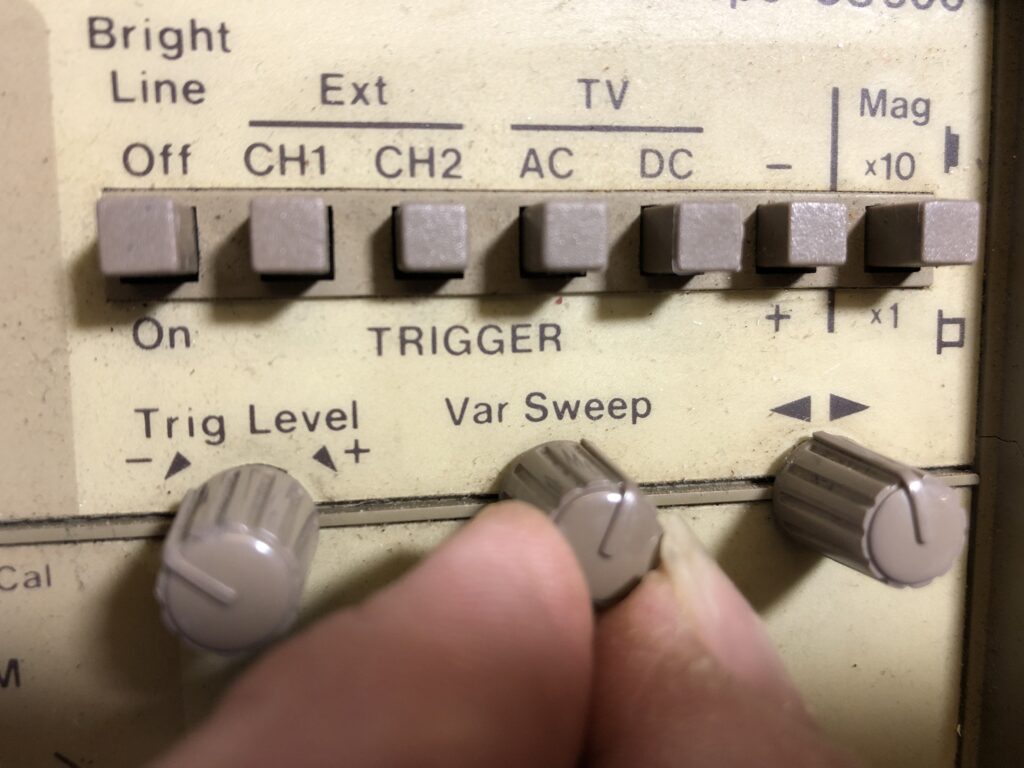
I then used the var sweep adjustment to bring the entire ramp into view.
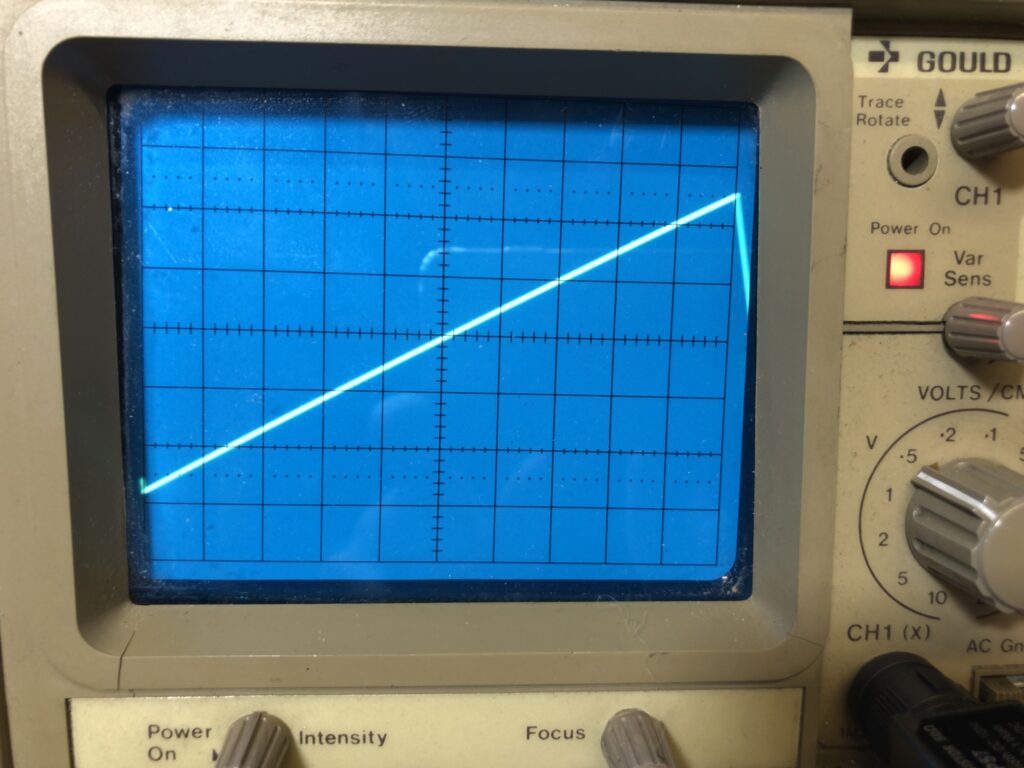
We now know that one sweep of the frequency range (that we still need to set) will be covered in one horizontal sweep of the screen.
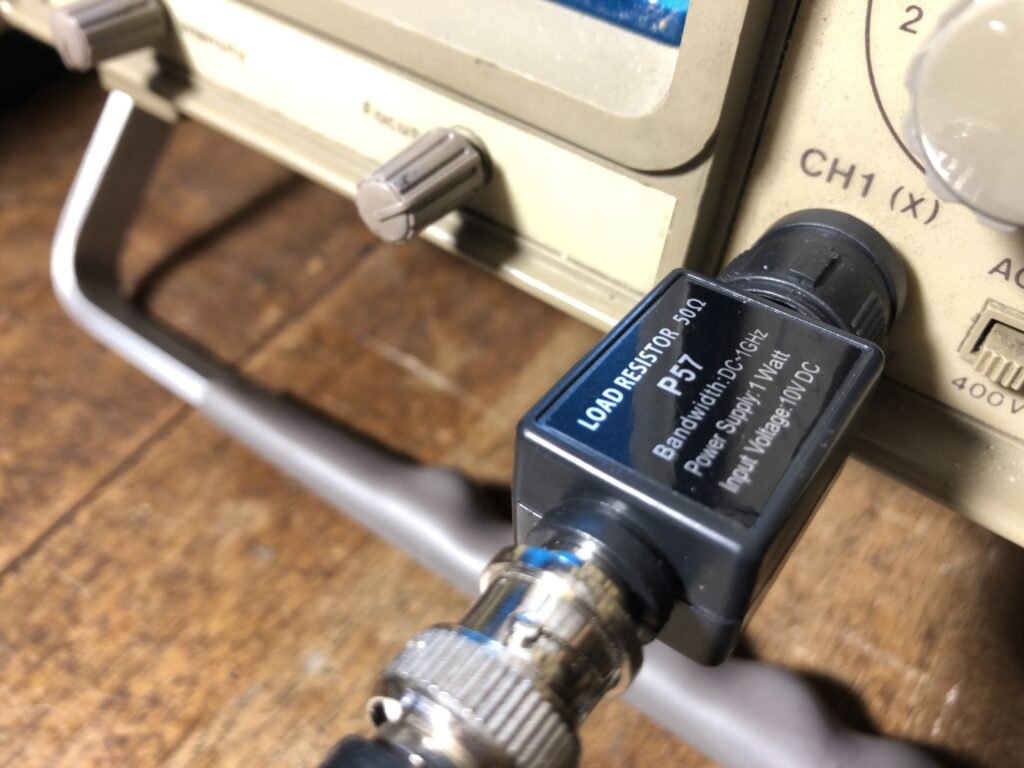
Now set the frequency range of the function generator to the required value and connect the output from the generator to CH1 on the oscilloscope. Note that the function generator is expecting a 50Ω load and I have fitted a 50Ω thru-terminator to CH1.
Set the oscilloscope to view CH1 only, leaving CH2 as it is (we don’t need to see the CH2 trace now that it is set). Set the function generator to start sweeping. You should see, as you are connected directly to the function generator, a level response.
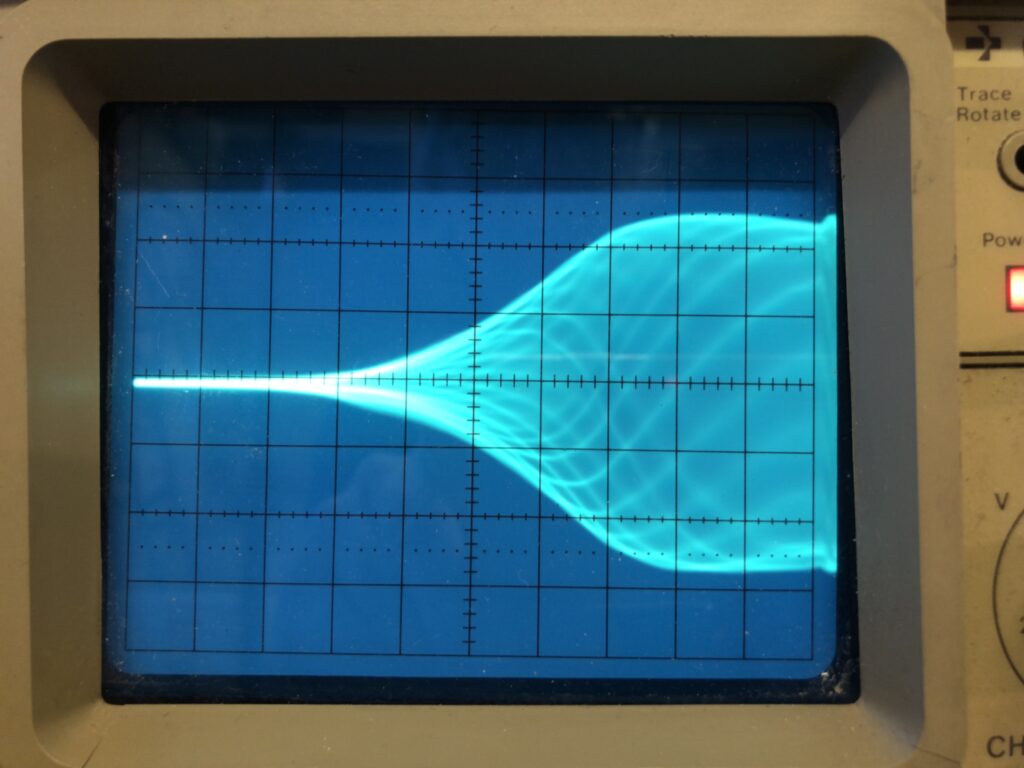
Now, connect in the filter under test and you will be able to view the response curve for the filter under test, directly on the oscilloscope screen.
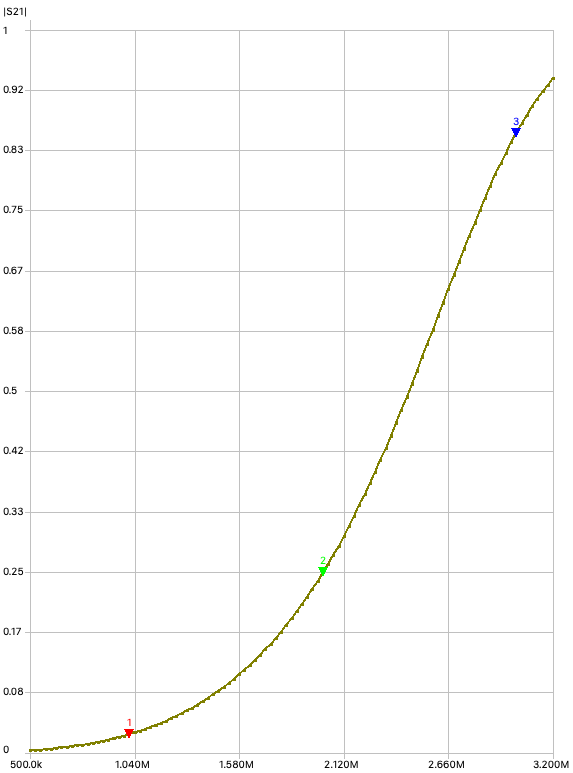
NanoVNA Results
Let’s compare the oscilloscope trace to the results from the NanoVNA.
Summary
Using the sweep function on a signal generator, combined with an oscilloscope does allow you to get an idea of the frequency response of the filter under test. Clearly, using the NanoVNA and software such as the NanoVNA Saver makes the whole process easier and provides more information, but the old analogue ways still work just fine!